blog: Big Data, Bigger Impact | Evidence-Based Transport Solutions
Wednesday 2nd April 2025

An Associate at ITP with more than 15 years of experience, Dr. Mark Dimond is a data scientist who uses his skills to exploit open data to better understand patterns of movement. His expertise encompasses GIS, statistical modelling, and computer science, and he has experience leading data strategy projects both internationally and for local authorities in the UK.
Recently, the ITP team responded to the DfT’s Integrated National Transport Strategy (INTS) ‘Call for Ideas’. This post is the first in a series of more detailed follow-ups from our experts on the topics raised.
Data is the evidence you need
As discussed in our response, traveller-facing information (real-time journeys, service updates, route planning, etc) is crucial for achieving more sustainable transport networks by improving experiences of public transport and active travel. But this post will explore the planning angle, where diagnosis, analysis and evidence-led decisions help to deliver lasting network improvements for the travelling public.
For thirty years, computers have been getting smaller, cheaper, and increasingly attached to all types of sensors and detection systems. ‘Big’ data was seen as the next big thing ten years ago – but the challenge of making use of improving technology remains. At ITP, we understand that data is evidence: a description of the real world, with numbers that relate to things that you need to know. But the biggest challenge can be understanding what your evidence is telling you.
Improving journey times in Portsmouth
A great example of this is the work we did with Portsmouth City Council recently. An ITP team was given the task of using Automatic Vehicle Location (AVL) and GPS data from the city’s buses to understand where delays to services were happening. We cleaned 4 million data points, calculated the speed at each, and assigned them to the city’s road network, to give us a detailed picture of the most congested road sections that buses use, and the volumes of passengers affected. This intelligence helped Portsmouth to develop scheme proposals for improving bus speeds in the city.
New data sources for transport intelligence
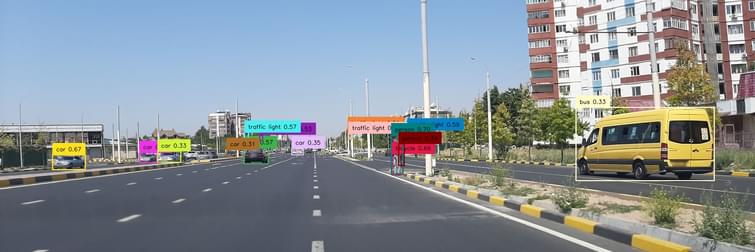
As well as using more established sources like AVL/GPS, our team have led the development of new approaches. Working internationally as well as in the UK, we are accustomed to ‘data poor’ environments, where routes, timetables, and even mapping can be outdated or incomplete. Our project with the Foreign, Commonwealth and Development Office’s High Volume Transport research programme for developing countries allowed us to develop a computer vision tool to detect and count different modes of transport in low- and middle-income country cities (in this case, Sierra Leone and Tajikistan).
Computer vision is the ‘quiet revolution’ taking place in machine learning, while the noisier GenAI is providing us all with inedible recipes and unfunny jokes. Having the ability to rapidly count cars, buses, and pedestrians at every point in a city, from pre-existing datasets, gives our international team the ability to develop a rapid understanding of our project locations, giving mode-share, neighbourhood intelligence, and network speeds. This often uses data that already exists online – or can be captured cheaply using commodity tools such as Android smartphones.
Fare modelling from big survey data
Our final example of ‘data as evidence’ is recent work we’ve completed for a major city region in the north of the UK. Our client had a comprehensive survey dataset: hundreds of thousands of origin-destination datapoints for passengers using their network. Our work helped them to understand what changing fare boundaries would do to ticket revenue – and helped them play out different scenarios to target revenue neutrality and maximising public transport uptake. Our work also considered the distributional aspects of ticket pricing, ensuring that price changes did not further disadvantage the less affluent of the region. The resulting financial forecasting is not just evidence-based, but crucially, based on the biggest set of evidence available.
So what?
These three examples show different ways in which the ITP and Royal HaskoningDHV teams have used new and larger datasets to target our clients’ priorities in different ways. We understand the latest data sources that cover your local area or organisation’s operations, and can relate them to evidence that targets your priorities, whether it’s faster buses, improved active travel, or more broad economic growth. If you'd like to learn more, please get in touch or contact Dr. Mark Dimond.
